Introduction
Pupils experiencing persistent disadvantage consistently demonstrate some of the lowest educational outcomes in the system – falling, on average, nearly two years of learning behind their peers by the time they sit their GCSEs. Yet identifying and targeting this group at school level remains a practical challenge, compounded by Universal Credit protections that make disadvantage harder to measure directly.
Produced by the Education Policy Institute for Teach First, Persistent disadvantage: Further analysis for Teach First draws on publicly available data to provide a detailed portrait of this pupil group, including breakdowns by geography, ethnicity, and special educational needs status, as well as school-level measures of the persistent disadvantage gap.
Background
Most measures of disadvantage used in schools look at whether a pupil is eligible for free school meals at a single point in time, or at any point in the last six years. Those measures group together pupils who spend a few months in poverty with pupils who spend their whole childhood in it, and our previous work has shown that the two groups have very different outcomes.
Teach First asked us to look in more detail at the pupils who are disadvantaged for most of their time at school: where they are, which schools they attend, and how their outcomes compare with those of their peers. This report uses the national pupil database to answer those questions for pupils who finished key stage 4 in the most recent year for which data is available.
Data Points
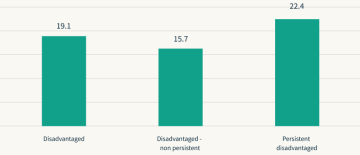
Persistently disadvantaged pupils are 22.4 months behind by GCSE
Around one in ten pupils in England sitting their GCSEs has been eligible for free school meals for at least 80 per cent of their time at school. By the end of key stage 4, these pupils are 22.4 months behind their peers who have never been disadvantaged.
- Pupils who are disadvantaged for shorter periods are 15.7 months behind, so the length of time spent in poverty matters as much as poverty itself.
- The share of pupils who are persistently disadvantaged has risen steadily, and the gap between them and their peers has grown since 2019.
The gap is already visible at the start of primary school and widens at every key stage after that.
Analysis
Gaps vary widely by region and ethnicity
The gap is smallest in London and largest in parts of the South East and South West. It is also much wider for White British pupils than for most other ethnic groups: persistently disadvantaged White British pupils are between 22.8 and 27.7 months behind, depending on the region, compared with between 9.4 and 17.4 months for pupils from other backgrounds.
Closing Thoughts
Persistent disadvantage is concentrated in particular places and particular schools, which makes it possible to target support where it is needed most. Schools serving the largest numbers of persistently disadvantaged pupils also face the greatest difficulty recruiting and keeping experienced teachers.
We recommend that government weights pupil premium funding towards pupils who have been disadvantaged for longest, publishes school-level data on persistent disadvantage, and offers incentives for experienced teachers to work in the schools with the highest levels of disadvantage. The full report sets out the data behind each recommendation.